|

Financial and economic
appraisal of efficiency of investment
Investment and industrial expenses, product cost structure
Table 24 shows capital investments for initial construction
stage facilities for new industrial complex.
Table 24.
| Name of expenses |
Cost, thousand of US dollars |
| priority |
including |
| |
In total |
1, 2 start up |
3 start up |
| Capital investment |
1 075 808 |
836628 |
239180 |
| VAT |
193 646 |
150594 |
43052 |
| Totally |
1 269 454 |
987222 |
282232 |
20 year period of project estimation, including 2 years for
construction of 1st and 2 nd start up complexes, construction
of further facilities is done in line with exploitation oа
terminals built earlier.
Table 25 shows product cost structure and industrial expenses
Table 25 - Cost structure and full current project expenses
(6th year after project implementation)
| Name
of expenses |
Expenses, thousand US dollars |
| priority |
| 1 |
Repair |
10 758 |
| 2 |
Others (auxiliary, inferiors, lubricants,
wipers and others) |
727 |
| 3 |
Fuel for gas turbine plant |
1 874 |
| |
Fuel, oil and lubricants (mechanization) |
1 035 |
| 4 |
Salaries (including single social tax)
|
6 118 |
| 5 |
General industrial and factory expenses
(business trips, maintenance of working vehicles, hospitality
expenditures, environment protection, communication services,
clerical and others) |
1 585 |
| |
Maintenance charges in total |
22 097 |
| 6 |
Amortization |
64 549 |
| |
Full current expenses |
86 446 |
Revenues
Components of revenues:
1) cash receipts for loading-unloading works:
- full containers– 136,4 dollar/container;
- empty containers – 81,4 dollar/container;
- oil products– 8,8 dollar/t;
- LHCG – 49,5 dollar/t;
- coal– 4,73 dollar/t;
- grain – 6,05 dollar/t;
2) revenues form port charges of transport vessels, calculated
according to “ доходы от взимания портовых сборов с транспортных
судов, рассчитанные по «Rate of charges from vessels in Russian
Federation trade ports”, approved by Ministry of Economy of
Russian Federation 28 August 1995 and registered in Ministry
of Justice of Russian Federation 28 October 1996, registration
№1184, valid for other ports of Azov and Black sea region.
Mooring, vessel, canal, environmental and navigation charges
are included in project estimation.
Basic technical and economic rates
Estimation is done considering Russian law of taxation on
1 January 2006.
Project financial condition:
- capital base– 25%,
- borrowing costs – 75%, with 2 years moratorium on interests;
- reimbursement of credit - according to project possibilities,
herein all idle money will be meant for reimbursement of credit;
- credit rate – 6% annually.
Discount cash flow analysis is done by using program product,
worked out by consulting service company «ALT-Investтм 4.0»,
Saint-Petersburg. Table 26 shows the analysis results
Тable 26.
| Index |
Unit |
Figures |
| priority |
| 1 |
Volume of services in value
terms |
Millions of dollars |
312,1 |
| 2 |
Estimated cargo turn over: |
|
|
| |
containers TEU |
thousand TEU /year |
500 |
| |
Oil products |
Thousand t/year |
5 000 |
| |
LHCG |
Thousand t/year |
2 000 |
| |
grain |
Thousand t/year |
5 000 |
| |
coal |
Thousand t/year |
10 000 |
| 3 |
Total quantity of employees |
persons |
1 440 |
| 4 |
Total value of construction including VAT
|
Millions of dollars |
1 269,5 |
| 5 |
Construction durability |
year |
4 |
| 6 |
NPV |
Millions of dollars |
624,7 |
| 7 |
IRR |
% |
17,8 |
| 8 |
Payback time (simple) |
years |
7,0 |
| 9 |
Payback time (discounted, at the rate of
10%) |
years |
9,7 |
| 10 |
Taxes and payments to non-budget funds
* |
Millions of dollars |
63,1 |
* Data for 6th year of project implementation.
Economic and financial rates should be reviewed on further
engineering.
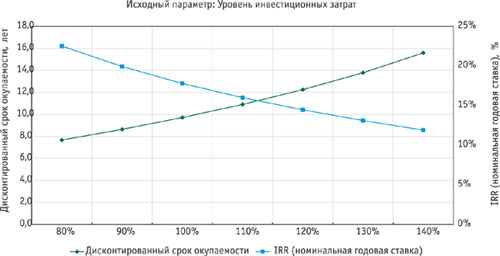
Impact assessment of exogenous factors on project effectiveness
is shown in diagrams by one-parameter and two-parameter analyses.
АЛЬТ-Инвест™ 4.0 Alt-Invest |
|
|
|
|
|
|
|
|
|
| sensitivity analysis |
|
|
|
|
|
|
|
|
|
One-parametersensitivity analysis |
|
|
|
|
|
|
|
|
|
| Initial parameter |
|
|
|
|
|
|
|
|
|
| |
initial value |
Step of change |
|
|
|
|
|
|
|
| Level of investment outlay |
80% |
10% |
80% |
90% |
100% |
110% |
120% |
130% |
140% |
| Resulting indexes |
|
|
|
|
|
|
|
|
|
| net present value |
years |
|
7,7 |
8,6 |
9,7 |
10,9 |
12,2 |
13,8 |
15,6 |
| IRR (internal rate of return) |
Thsnd.doll. |
|
23% |
20% |
17,8% |
16% |
14% |
13% |
12,8 |
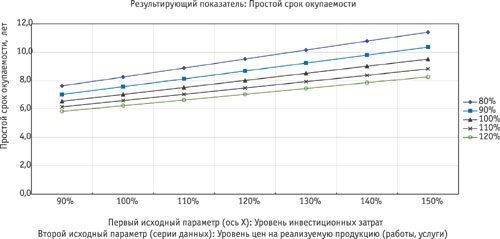
Two-parametersensitivity analysis |
|
|
|
|
|
|
|
|
|
| Initial parameter |
|
|
|
|
|
|
|
|
|
| |
initial value |
Step of change |
|
|
|
|
|
|
|
| Level of investment outlay |
90% |
10% |
|
|
|
|
|
|
|
| Level of prices on the saleable production (works, services) |
80% |
10% |
|
|
|
|
|
|
|
| Resulting indexes |
|
|
|
|
|
|
|
|
|
| Simple payback period |
% |
|
|
|
|
|
|
|
|
| |
|
|
|
|
|
|
|
|
|
| |
Level of investment outlay |
|
|
| Level of prices on the saleable production (works, services) |
90% |
100% |
110% |
120% |
130% |
140% |
150% |
Доход, долл./т |
| 80% |
7,6 |
8,3 |
8,9 |
9,5 |
10,1 |
10,8 |
11,4 |
9,3 |
|
| 90% |
7,0 |
7,6 |
8,1 |
8,7 |
9,2 |
9,8 |
10,3 |
10,4 |
|
| 100% |
6,5 |
7,0 |
7,5 |
8,0 |
8,5 |
9,0 |
9,5 |
11,6 |
|
| 110% |
6,2 |
6,6 |
7,0 |
7,5 |
7,9 |
8,4 |
8,8 |
12,8 |
|
| 120% |
5,8 |
6,2 |
6,6 |
7,0 |
7,4 |
7,9 |
8,3 |
13,9 |
|
| Capital investment including VAT, mln. dollars |
1 142,6 |
1 269,5 |
1 396,5 |
1 523,4 |
1 650,4 |
1 777,3 |
1 904,3 |
|
|
Однопараметрический анализ чувствительности
Двупараметрический анализ чувствительности
|

